Covid by Age Group
We hear that covid is more serious for older people and that children don’t get it much.
Being a number person, I like to see the numbers. I went to CDC and got the latest covid hospitalization data. After some manipulation in MATLAB, I created Figure 1, the fraction of new hospitalization by age group.
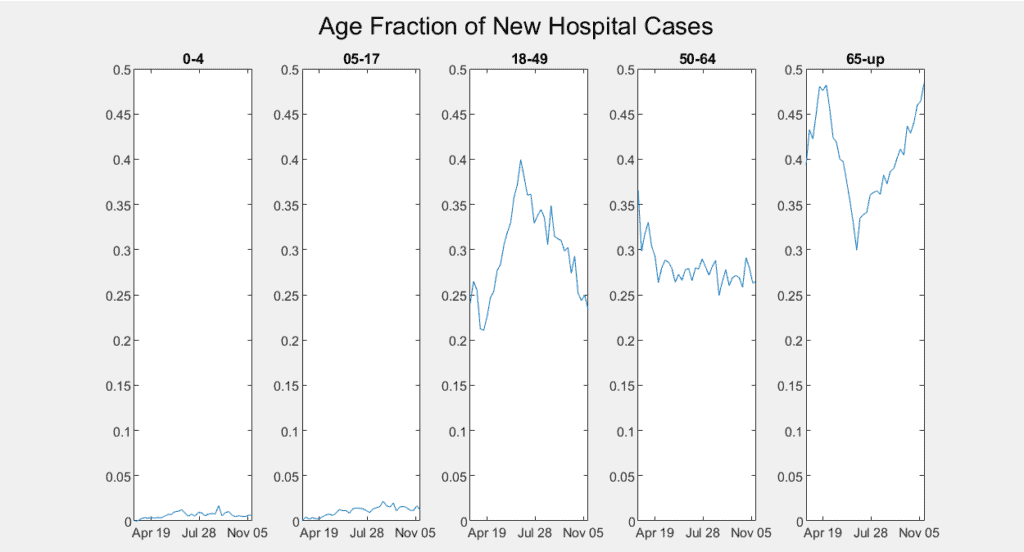
- Children under 5 account for about 1% of all covid hospitalizations. Not zero. It does happen, but it’s a low rate.
- Ages 5-17 are rarely hospitalized for covid, accounting for 2-3% if all admissions.
- Young adults, from 18-49, currently comprise 25% of all admissions, but it has been as high as 40%.
- Middle-age adults, 50-64, are a few percentage points about the younger adults, 27%.
- Seniors, 65 and up, earlier this year were nearly half of the hospitalization. That dropped to a third in mid-summer and have now return to nearly half of all admissions again.
That’s the hospital fraction by age group, but what is the weekly rate of new hospital cases? See figure 2.
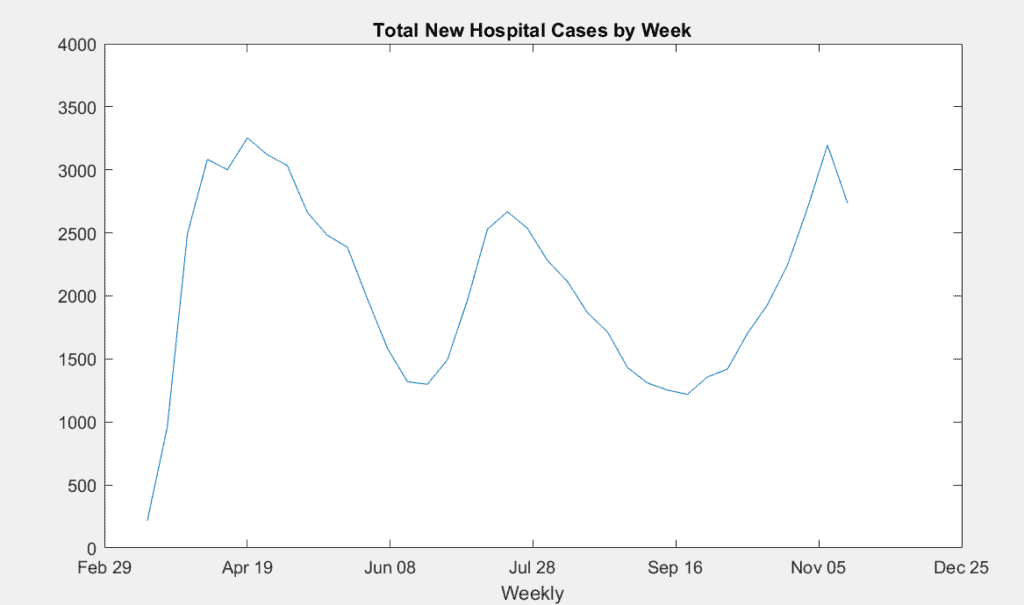
The last week which shows a dip is probably misleading. The collection of hospital data from across the nation often takes more than one week to complete.
The graph shows we are in the third wave.
It’s hard to wait for vaccines and a return to normal life.


There’s 100,000 covid patients in the hospitals now. One to two thousand of those patients are under age 4. One percent is not insignificant when dealing with large numbers.