BGE Bills Show Temperature Rise
We’ve lived in the same house for 30+ years. Back in 1992, I started tracking our electric usage. Since I wanted to see how energy consumption related to temperature, I’ve recorded the average temperature monthly since then.
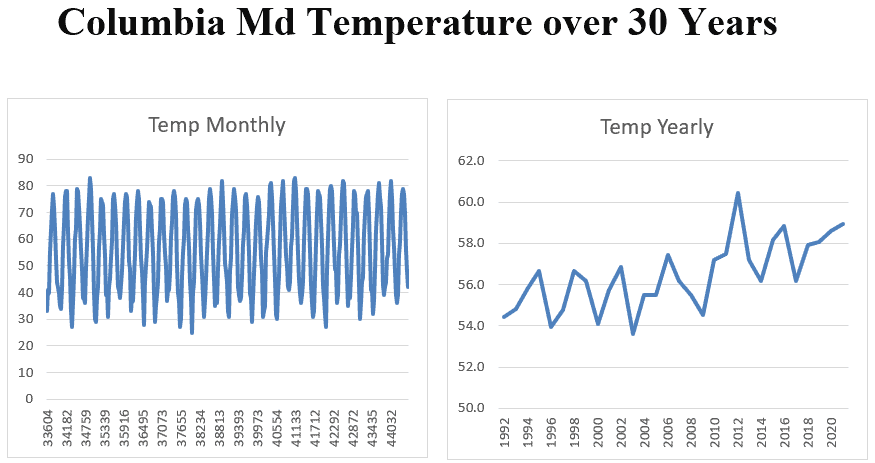
Monthly
From one month to the next the temperature varies so much that the ups and downs obscure any long-term trend. Nonetheless, I like seeing the periodic change from 30 F to 80 F and all over again. The numbers below the x-axis are the internal date numbers of the months.
The highest monthly temperatures appear steady with perhaps a slight increase in recent years.
The lowest monthly temperatures each year seem to show a rise in recent years.
But the yearly cycle of cold months, followed by warming temperatures peaking in August, and then declining through the chill of the next winter makes it impossible to see beyond the yearly cycle.
Yearly
By averaging the monthly averages into a yearly average results in the graph on the right. A rise in the average yearly temperature is clear in recent years.
Up to 2010, yearly temperatures in mid-Maryland ranged between 54 F and 57 F. Since then, between 56 F and 60 F.
In thirty years, the yearly lows and the yearly highs are both up about 2 degrees.
Warming
Warming in my neck of the woods has occurred. Will it continue?