Monte Carlo with $100,000 in the Stock Market
Update 2023.10.24: Added table of five Monte Carlo simulations that had been inadvertently dropped.
If you have a $100,000 to invest in the stock market, what amount can you expect to have in 10 years?
Average Growth
One way to proceed is to assume you will earn its average historical performance every year. That is a bit shy of 10% growth per year the S&P 500 experienced from 1926 to 2010. Let’s round it to 10%. You can expect to have $259,374 at the end of ten years.

This is a pleasant chart to contemplate, but we know the stock market goes down as well as up. The above chart removes that reality from your consideration. You might be forgiven for thinking and preparing to receive $259,374 in 10 years.
Monte Carlo Simulation
Another method to consider the future value of a $100,000 portfolio is called Monte Carlo simulation. With it, the chaotic nature of growth and drop the market experiences over the years is brought into play. I segmented the 85 years of market performance (as reflected in the S&P 500) into 9 ranges, then randomly selected each year’s stock market change from them. In this way, the uncertainty of market performance is retained, yet bounded by past experience.
There are some years with very bad losses. As the chart shows, in three of those 85 years, the stock market fell between 30% and 50%
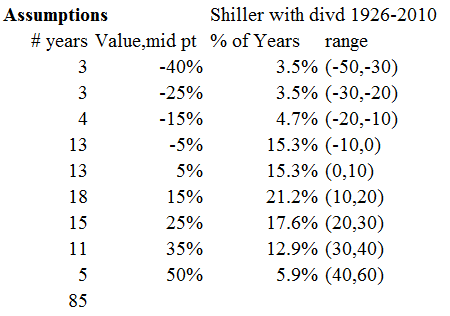
Among these nine intervals, I randomly select a return for the first year, then the second year, and so on until the ten years are done. That is simulation one. I do the same procedure, of course starting with the same $100,000 portfolio for simulation 2 through simulation five.
In the table below, your $100,000 goes through in five different scenarios off stock market returns. The five simulations show the randomness of market returns can make Sim 2 and Sim3 star performers and Sim 5 a very disappointing performer.
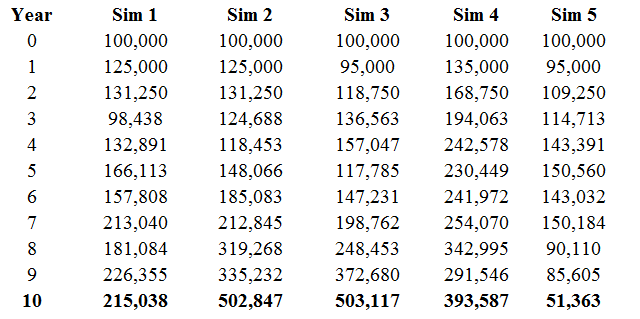
The smooth prediction of $279,374 has been replaced by a $450,000 range.
It’s jarring to realize that the timing of market rallies and drops can swing your portfolio between $51,000 and $500,000.
Of course, it would be foolhardy to ignore the possibility. Step one is don’t pull all your funds in stocks.


The simulation doesn’t have a specified starting year. Any year will do.
The way it works is that the $100,000 ‘pot’ is the starting condition. Then annual returns (selected randomly from actual returns over the years from 1927 to present) are applied year after year.
Do you have the starting years for the 5 simulations?