Inflation Measurement
CPI Inflation
The monthly CPI announcement gets the lion’s share of inflation attention, but it’s only half the story. The other side of the story is earned income.
Is your income keeping up with inflation? If it is, then inflation is a false bogeyman. If it’s not, then you experience inflation.
Be aware, that CPI measures consumption. It ignores other expenditures that make demands on our income and doesn’t measure their inflationary trends. For instance, income taxes collected by states, municipalities and the federal government are not included in CPI. They have gone up, both by legislative action and by tax table bracket creep, due to increasing nominal (non-inflation adjusted) income.
Another point to keep in mind is the distinction the Fed makes between headline and core inflation.
- Headline inflation is the increase (usually) of the cost of purchasing a statistically maintained market basket of goods and services.
- Core Inflation is the increase in the cost of purchasing the market basket less the food and energy goods and services. Why are they removed? Because their prices bounce around quickly to external factors that Federal Funds policy can’t easily effect. The core inflation is the guide the Fed considers in taking their actions.
Headline inflation is the basis for social security adjustments announced annually. Before retirees get too excited, it’s important to note that the announced CPI is for Urban and Clerical workers, with 7.5% of the market basket set aside for health care. CPI-UandC increased 2.5% annually from 1991-2011, while healthcare costs increased 6.1% annually in the same period.
Core inflation is important when monitoring monthly changes and considering policy responses—rate changes typically take (lag) 9-12 months to work themselves into the economic system. Of course, the changes to food and energy prices can’t be ignored in the longer term. Energy and food make up 23% of our living expenses (in the statistical goods and services basket).
The sticker shock you get in the grocery store is apparent inflation. Apparent inflation ignores whether your salary is keeping up. Actual inflation occurs when your income can’t buy the same daily goods with your salary or when you have to work longer to earn enough to purchase that market basket.
Change in CPI Purchasing Power
Let’s look at the change in purchasing power within the US as shown by how the change in the number of work hours required to purchase the CPI basket. Because the raw good prices in the CPI are not released by BLS (Bureau of Labor Statistics), I will use the CPI values over the years as a reflection of the apparent change of inflation, despite the shortcomings of the indexClick for more
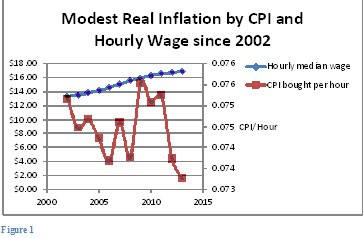
In Figure 1, the blue line shows increasing hourly median wage (left axis shows dollars/hr). The gyrating red line indicates how much CPI can be bought with an hour’s work earning the median salary level (right axis). The median hourly wage has been modestly rising, but the amount of CPI it buys fluctuates more dramatically, since the inflation rate jumps about. In the latest year, an hour’s work will only buy 7.3% of the cost of living
Over the 2002-2013 period, CPI has increased 2.4% per year. Median salary has nearly matched that. It’s grown 2.2% per year. Thus real inflation has grown about 0.2% in the past 12 years, very benign.
I am surprised by the no inflation result. That doesn’t seem to match the inflation experience most people report. A couple caveats: median hourly salary doesn’t show many hours these employees actually worked and more importantly, doesn’t address those not working.
Big Mac Purchasing Power Parity
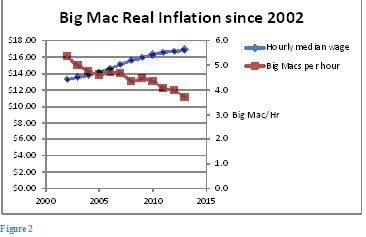
The Big Mac index was conceived and has been kept current by the Economist to compare purchasing power across countries, yet it also allows us to compare US purchasing power across time. In figure 2, the red line shows how many Big Macs are earned with an hour’s effort at a median salary. It slopes down to the right. The median worker can buy less and less with his hour’s effort, despite his increasing dollar wage, shown with the blue line. Why? How? The Big Mac’s price is increasing faster than his salary. Since 2002 the nominal price of a Big Mac has risen from $2.49 to $4.56 (83%) , equivalent to an apparent annual rise of 5.6% . The median salary over the same period rose from $13.31 to $16.87 (27%), equivalent to an annual increase of 2.2%. The real inflationary effect is 3.4% (5.6%-2.2%).
Reflection On Inflation Measurement
Since 2002, as measured by the CPI, there has been low apparent inflation pretty closely balanced by low median salary growth yielding relatively steady purchasing power.
But official figures must be reviewed with the recognition that there are two contradictory goals in reporting inflation. The government wants it as low as possible to limit the increases like social security annual adjustments. On the other hand, it wants it to be high, making it easier to pay off existing government debts with cheaper dollars.
Leaving the government to want inflation to be high, but reported low.