Fed’s Dual Mandate
My Initial Belief
When I first heard that the Federal Reserve Board (Fed) raised interest rates to fight inflation, I was perplexed. How could making the cost of buying items with a higher interest rate reduce inflation? Higher interest rates make items more expensive!
Slowly I learned that the Fed was affecting the macro-economy, the aggregate amount of demand for all goods rather than a single purchasing decision I might make. With the final price of all goods boosted by the rising interest rates, people buy less overall, which hinders companies from raising their prices, relieving inflation.
Counter-intuitive logic that seems to work.
Dual Mandate Purpose
The Federal Reserve Board has a two-fold task. Keep prices stable and maximize employment. The Fed uses its Funds Rate to adjust the easy or difficulty of getting loans in the general economy. The intention is to slow a racing economy (seen by rising inflation) or pump up a sagging economy (seen by increasing unemployment). The Fed has developed additional tools, like quantitative easing, to implement monetary policy, but this post does not discuss them.
Show More about Fed RatesExamining Rates
Fed Reserve Rate
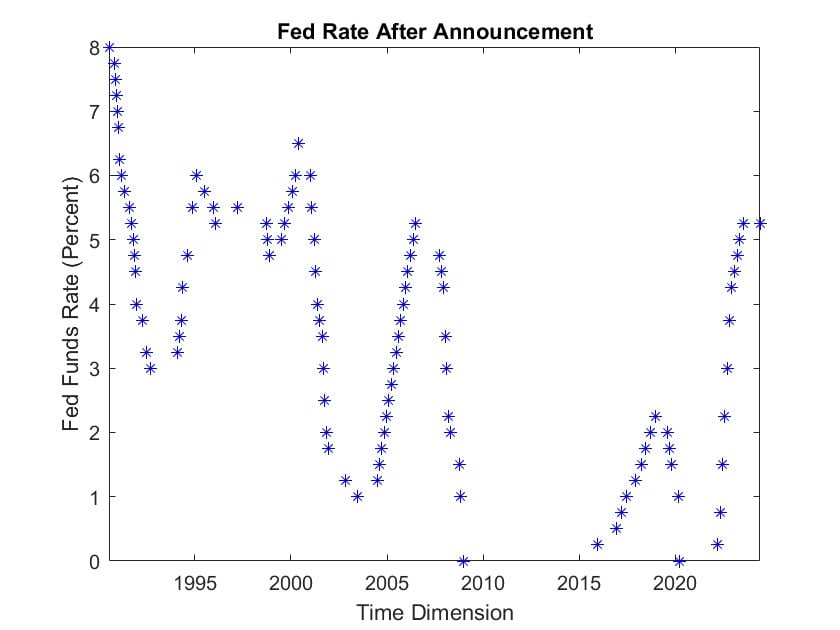
The Fed Reserve Rate sets the overnight loan rate banks can charge each other through the Fed depository system. The target range is set by the Fed, which then ensures that the rate stays within its boundaries.
The Fed Rate plot on the left shows the ups and downs in the years since 1990. Note, there were no changes in the Fed rate from 2008 through 2015.
Interest rates that you and I are offered, like for mortgages, on our credit cards, personal loans, and business loans, are higher than the Fed rate. The Fed rate has the lowest risk of default in the financial system. All other rates add on additional interest, reflecting the chance of non-repayment.
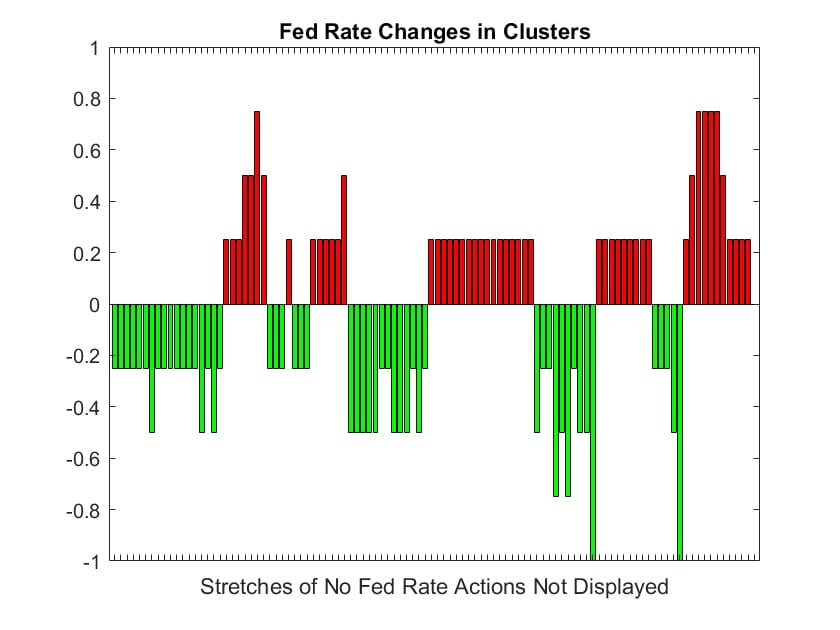
The bar chart on the right shows the Fed has worked on the economy in 10 clusters of rate changes in the last 35 years.
Increases are colored red, because they put a brake on the economy, while decreases are colored green, because they boost the economy.
Inflation Rate
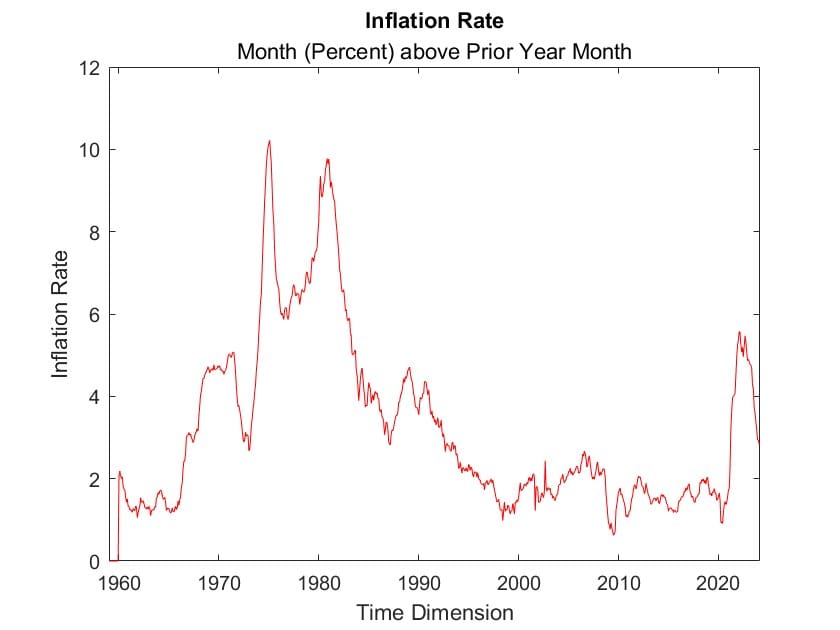
The inflation level used by the Fed as measured is often less than the level experienced. Look at 2022 peak. It’s shy of 6%, while it was much higher at the grocery store. Why? Because energy and food are excluded because their cost factors that are outside of economic control. These so-called exogenous factors include geopolitical risks, pandemic, disruption of supply chains, poor harvests, oil price shocks in the 1970s, 9-11, natural disasters, and so on. Monetary policies aren’t able to anticipate non-economic causes, so they are reasonable for exclusion, not because they are unimportant, but because they are outside of economic control.
Fed Real Rate, Adjusted for Inflation
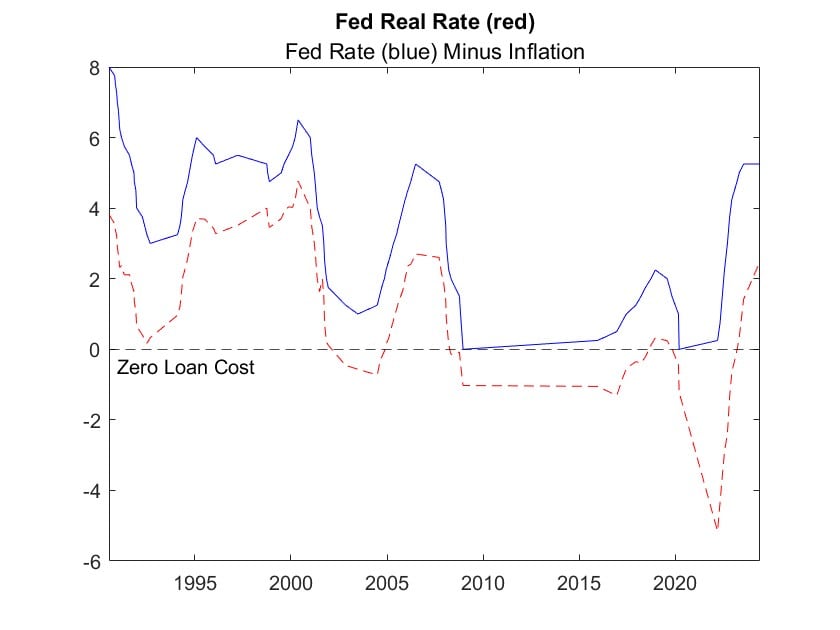
The announced Fed rate is the nominal rate unadjusted for inflation. Because borrowers repay loans over time, it makes sense to calculate the Fed real rate by subtracting the inflation rate, as repayment will be made in cheaper dollars. There are numerous occasions when the inflation rate was higher than the Fed Rate. The upshot is that a loan taken out has very little real cost. This easy money situation can lead to funding reckless ventures which higher Fed rates would not support. That contributes to the boom-or-bust of the business cycle.
The chart above, Fed Rate and Real Rate shows that the nominal Fed rate (in blue) has varied from 8% in 1990, down to zero, then back up to 5.25% in 2024. The real Fed rate adjusted for inflation (dashed red) has declined from 4% in 1990 (Fed at 8% and inflation 4%) to nearly 0% in 1992 (Fed at 3%, inflation about 3%). On the far right, Fed is at 5.25% and inflation is about 2.9% meaning the real rate, after the recent Fed hiking cycle, is a positive 2.3%, restricting loans to the most promising projects.
Unemployment Rate
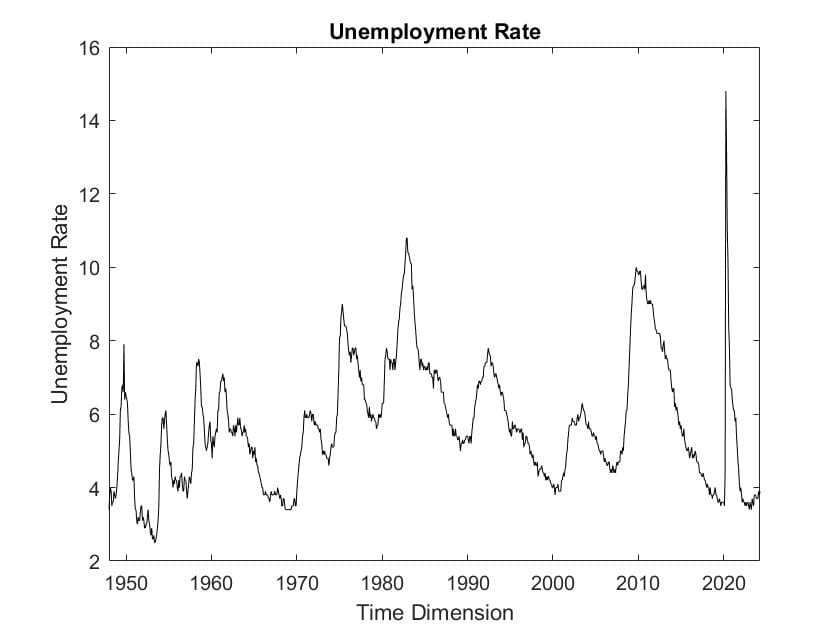
The flip side of the Fed’s mandate is seen in the unemployment rate.
Up to the 1990s, the ups and downs were closely spaced. Since then, their pace has lessened. Notice the Great Recession’s unemployment peak of 10% in early 2010 took until the end of 2015 to return to a 5% unemployment rate. From 2010 to 2015, the Fed Rate was unchanged and bounded at 0-0.25%.
Natural (Neutral) Interest Rate
The natural or neutral rate is the theoretical interest rate at which the economy will operate most efficiently (with low inflation and maximum employment). The Fed considers the neutral rate in making Fed rate decisions (Chairman Powell estimates it as 2%). If the Fed fund rate is above the neutral rate, then the economy will slow down and ease inflation. If the Fed rate is below the neutral rate, then the economy will speed up and increase employment.
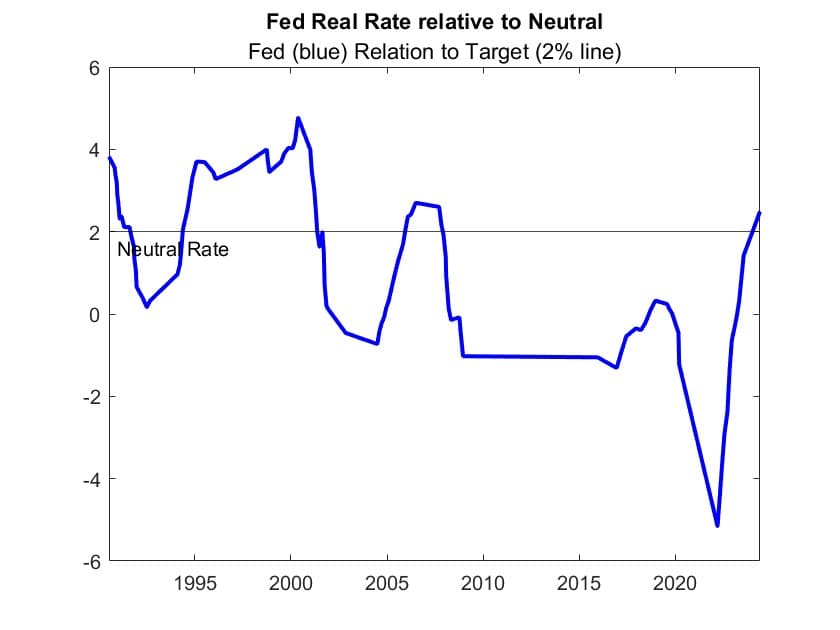
The plot shows that since 2008, of the Housing debacle and the Great Recession, the Fed real rate has been below the neutral rate, thus boosting the economy.
How well has the Federal Reserve handled its Dual Mandate?
Fighting Inflation
| Date | Fed Rate | Inflation | Fed Real Rate | Unemployment |
| 2021-03-15 | 0.00% | 2.26% | -2.26% | 6.1% |
| 2022-03-15 | 0.00% | 5.55% | -5.55% | 3.6% |
| 2023-07-26 | 5.25% | 4.19% | 1.06% | 3.5% |
| 2024-05-31 | 5.25% | 2.75% | 2.50% | 3.9% |
Recently, the Fed raised rates to quell inflation, which jumped to 6.5% from Dec 2021 to Dec 2022 for Personal Consumption Expenditures of core items (i.e. ignoring energy and food price changes as explained in the Dual Mandate section).
The table, Taming Inflation, has 4 dated rows for 4 crucial data points. The first row shows the economy one year before the Fed rate hikes started. In March 2021, we were still adjusting to the alarming COVID-19 pandemic. The Fed nominal rate was 0%. Inflation was a bit above 2%, implying the real rate of borrowing was less than zero. It was expansive to help counteract the pandemic disruptions which shows in the unemployment rate of 6.1%.
Row 2, Mar. 15, 2022 was the day before the Fed announced raising its rates. Inflation had risen to 5.55%, with a Fed rate still at 0% meant extremely cheap loan terms for companies with high credit worthiness. Unemployment had improved during the preceding year to 3.6% rate. The date is bolded to make the start of the Fed cycle noticeable.
Row 3, July 26, 2023 was the day after the Fed raised its rates to a peak of 5.25%. Inflation had declined to 4.19%, giving a Fed real rate of 1.06%. That’s above zero, so the economy is being tightened, but 1.06% is still below the neutral rate, meaning the economy is still experiencing relatively easy money. Unemployment has remained steady. The date is bolded to make the end of the Fed cycle noticeable.
Row 4, May 31, 2024 is the date with the latest data since the end of the Fed hiking cycle. So, the Fed rate remains at 5.25%. Inflation has continued its downward trend and is now at 2.75%. That results in the Fed real rate rising to 2.50%, above the neutral rate, implying tighter money supply, cooling inflation further. The unemployment rate has risen to 3.9% due to slowing economic activity.
The Fed has down a remarkably good job this far. That’s not to say inflation hasn’t made daily living more expensive than many can afford, but the Fed has ended the rapid inflation, though they must watch for potential unemployment rates to rise.
Taking actions involves risks. As we have experienced, higher interest rates can also cause unemployment to rise, the housing market to freeze up, bank balance sheets to deteriorate, and commercial real estate to lose its cost-revenue alignment.
Fighting Unemployment
The Great Recession following the housing bust lead to Fed lowering rates from 2007-09-18 to 2008-12-16.
| Date | Fed Rate | Inflation | Fed Real Rate | Unemployment |
| 2006-09-17 | 5.25% | 2.61% | 2.64% | 4.5% |
| 2007-09-17 | 5.25% | 2.10% | 3.15% | 4.7% |
| 2008-12-17 | 0.00% | 1.14% | -1.14% | 7.3% |
| 2009-12-16 | 0.00% | 1.51% | -1.51% | 9.9% |
Looking at the 2nd row, the day before the Fed announced it would be cutting its rate, neither inflation nor unemployment were out-of-line. The Fed’s dual mandate didn’t dictate a policy change; however, the bankruptcy of Lehman Brothers shouted that something was amiss in the financial marketplace and that it was tied to the housing crisis. Congress enacted fiscal policies, which the president signed, to ease the coming reckoning and the Fed acted to ease monetary policy to help mitigate the economic contraction that was inevitable.
The final column shows the rapid rise of unemployment. We can’t say the Fed (and fiscal policies) solved the unemployment problem. We can only make the counterfactual argument that things would have been worse, if nothing had been done.
Investigating when the Fed lowers its rate (to relieve unemployment rate rise), it seems that it is often triggered by non-monetary events, like the Dot-com bust followed 9-11.
The Federal Reserve’s Record
In researching for this post, I came across a Congressional Service Report on the business cycle with this interesting observation on the effect of the Fed’s efforts under its dual mandate.
- From the 1850s through World War II, the average expansion lasted about 26 months and the average recession lasted about 21 months.
- From 1945 to 2019 (the end of the most recent business cycle) the average expansion has lasted about 65 months, and the average recession has lasted about 11 months.
That’s an impressive improvement the Fed has managed. The average expansion has more than doubled in length and the average recession is barely half as long as previously.
Nonetheless, we mustn’t forget, difficult choices are forced upon the population from rising prices and real people underlie unemployment percentages that rise during recessions.
Additional Information
Business Cycle Congressional Report Service