Covid-19 Cases and Hospital Admissions

I’ve heard the doctors and newscasters say that hospitalizations occur a few weeks after the covid-19 cases occur. I wanted to see how long that lag was.

CDC Data

I went to the CDC site, poked around a bit and found the new cases by date data. A bit later I found hospital data. It recorded new admissions on a weekly basis. I downloaded both files, examined them a bit in Excel, then shifted over to MATLAB.

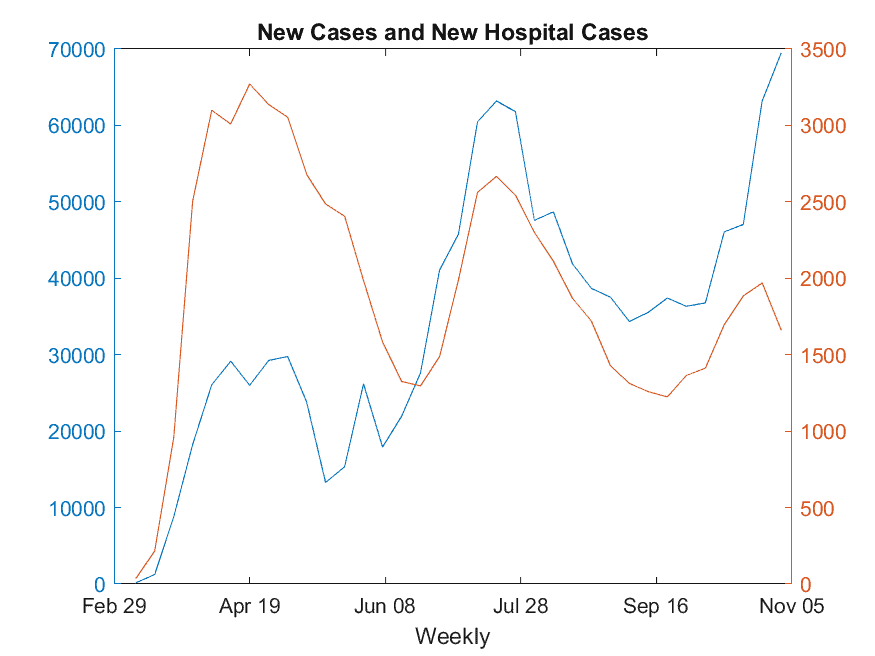
Graph of Covid-19 Data

New Cases in Blue. New Admissions in Orange

The graph shows a new cases peak about April 19 of 30,000 per day and a new hospital admissions peak of 3,200 per week. A second pair of peaks occur just prior to July 28 with 62,000 daily new cases and 2,600 weekly new hospital admissions. The third peak now 100,000 daily new cases doesn’t have matching hospital admission statistics yet. There’s a time lag in reporting.

We can see from the first two cycles that new hospital admissions peak very close to new covid-19 cases peak. That surprised me. I expected to see a two or three week lag. I will look as more data comes in to see if that synchronicity continues.

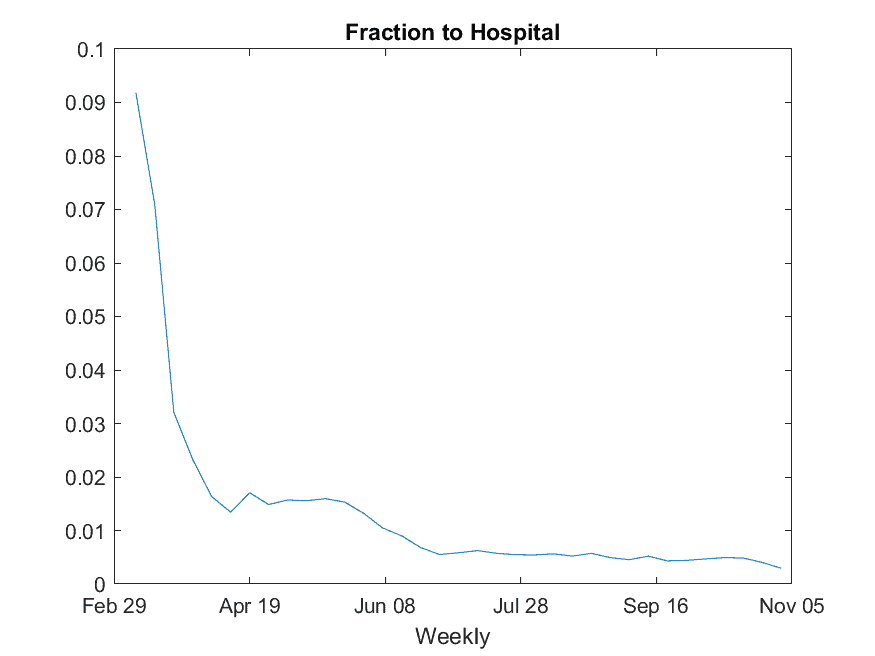
Fraction of New Cases Leading to Hospital

Dramatic Improvement in Fraction to Hospital

The graph above shows the dramatic improvement from 10% of all patients requiring hospitalization in March and April to below 1% now. The major decline resulted from the mainly successful effort to ensure that covid-19 did not run rampant through long-term care facilities. Thereafter less vulnerable persons (younger with fewer comorbidities) formed the infected population, requiring less hospitalization.

Math Thoughts

I’ve just used the most primitive tools in MATLAB so far. With so many hours available, I expect to examine the time series with polynomial fitting, covariance, and regression for further insights.


% LoadAndPrepCovidTimeSeries.m
% Load New Daily Cases. Date, NewCases, MovingAvg7Day
NewDailyCases = readtable(“case_daily_trends__united_states 2020.11.10.xlsm”);
NewDailyCases.Date = datestr(NewDailyCases.Date,’yyyy/mm/dd’);
NewDailyCases.Properties.VariableNames{‘x7_DayMovingAvg’} = ‘MovingAvg7Day’;

% Load New Weekly Hospitalizations.
% Columns Year, Week Number,
NewWeeklyHospital = readtable(“Covid Weekly_Hospitalization_Counts.xlsm”);
% Calc Total New Hospitalizations each week
[rows,~] = size(NewWeeklyHospital);
for r = 1:rows
TotalNew = NewWeeklyHospital.x0_4YR(r);
TotalNew = TotalNew + NewWeeklyHospital.x5_17YR(r);
TotalNew = TotalNew + NewWeeklyHospital.x18_49YR(r);
TotalNew = TotalNew + NewWeeklyHospital.x50_64YR(r);
TotalNew = TotalNew + NewWeeklyHospital.x65_YR(r);
NewWeeklyHospital.NewHospitalCases(r) = TotalNew;
end
NewWeeklyHospital = NewWeeklyHospital(:, [2,8]);

% Load Week Number 2020
% Columns WeekNumber, FromDate, ToDate
WeekNumber = readtable(“Week Number 2020.xlsm”);
[rows,~] = size(WeekNumber);
for r = 1:rows
str = extractBetween(WeekNumber.WeekNumber(r),6,7);
Number(r) = strcat(‘2020-‘,str);
end
WeekNumber.Number = Number’;
WeekNumber.Properties.VariableNames{‘Number’} = ‘WEEK_NUMBER’;
% Join Hospital and Weekly Number tables
NewWeeklyHospital = join(NewWeeklyHospital,WeekNumber);

save ‘m:\myDocs\MATLAB\Saved_Tables\NewDailyCases.mat’ NewDailyCases
save ‘m:\myDocs\MATLAB\Saved_Tables\NewWeeklyHospital.mat’ NewWeeklyHospital


% CovidHospitalInnerJoin.m
if exist(‘m:\myDocs\MATLAB\Saved_Tables\NewDailyCases.mat’) == 2
load NewDailyCases
load NewWeeklyHospital
else
LoadAndPrepCovidTimeSeries
end
NewDailyCases.DateNum = datenum(NewDailyCases.Date);
NewWeeklyHospital.DateNum = datenum(NewWeeklyHospital.ToDate);
T = innerjoin(NewDailyCases,NewWeeklyHospital);
T = T(T.NewHospitalCases ~= 0,:); % Remove last row, has no hospital count
yyaxis left
ylabel(‘New Cases’);
plot(T.DateNum,T.NewCases)
datetick(‘x’, ‘mmm dd’, ‘keeplimits’, ‘keepticks’);
xlabel(‘Daily’)
yyaxis right
ylabel(‘New Hospital Cases ‘);
plot(T.DateNum,T.NewHospitalCases)
datetick(‘x’, ‘mmm dd’, ‘keeplimits’, ‘keepticks’);
xlabel(‘Weekly’)
title(‘New Cases and New Hospital Cases’)
ax = gca;
ax.YAxis(1).Exponent = 0;
saveas(gcf,’M:\MyDocs\MATLAB\Misc\NewCasesAndNewHospitalCases.png’)

% Fraction to Hospital
figure(2)
T.FractionHospital = T.NewHospitalCases./(7*T.MovingAvg7Day);
ylabel(‘Fraction to Hospital ‘);
plot(T.DateNum,T.FractionHospital)
datetick(‘x’, ‘mmm dd’, ‘keeplimits’, ‘keepticks’);
xlabel(‘Weekly’)
title(‘Fraction to Hospital’)
saveas(gcf,’M:\MyDocs\MATLAB\Misc\FractionToHospital.png’)

Society

Leave a Reply

Your email address will not be published. Required fields are marked *

This site uses Akismet to reduce spam. Learn how your comment data is processed.

You May Have Missed