
Writing Assistant
MicroSoft 365 and Copilot might not make your writing mechanical, but make the most of your talents
Robert Hamill
MicroSoft 365 and Copilot might not make your writing mechanical, but make the most of your talents
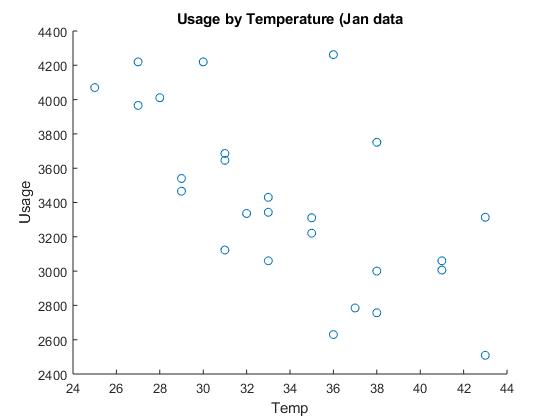
The MATLAB scatterplot clearly shows at low temperatures (towards the left), the most electricity is consumed (data points higher).