Home Electric Use and MATLAB
I started tracking home electric use in the 1990s. I wanted to see if the rhythm of temperatures matched the rhythm of usage. Since I got MATLAB, I want to see what I could do easily in it.
Monthly Temperatures
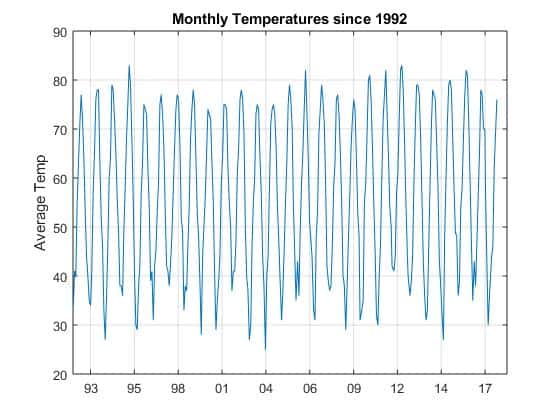
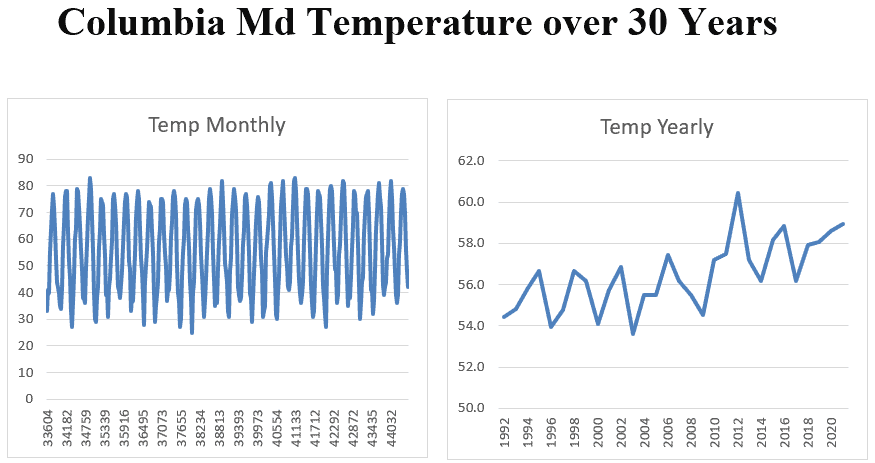
The plot of average monthly temperature for the past 25 years in mid-Maryland shows the yearly pulse. I early discovered that we used the most electricity for heating. The power company’s bill was twice as much in winter months.
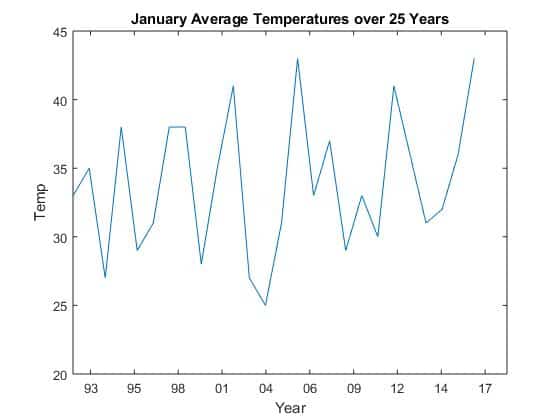
January Temperature Focus
With MATLAB, I was able to extract the January data and then plot it. That plot has a narrower temperature range, 24-44 degrees Fahrenheit. Interesting to note, its slight upward trend.
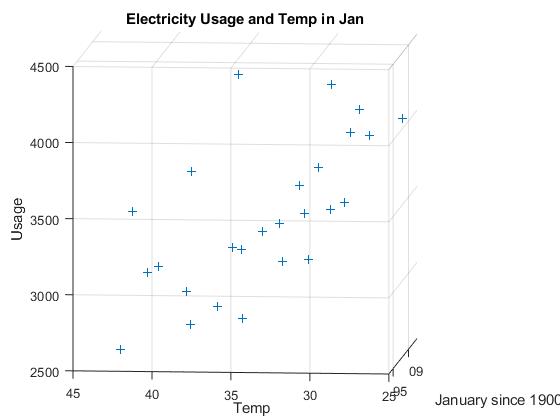
Usage and January Temperature
Let’s see how our usage varied with January’s average temperature. First I tried a 3D plot of usage by temperature and date. The plot was created, but it was not easily understood. In MATLAB, the 3D chart can be viewed easily from changing positions, which I couldn’t save for display here, but this snapshot shows the difficulty of understanding the information in the plot below.
Improved Temp Usage Plot
When I looked at the 3D plot, I realized the year did not add useful information. So I dropped it. Now I plotted usage against the temperature (of January).
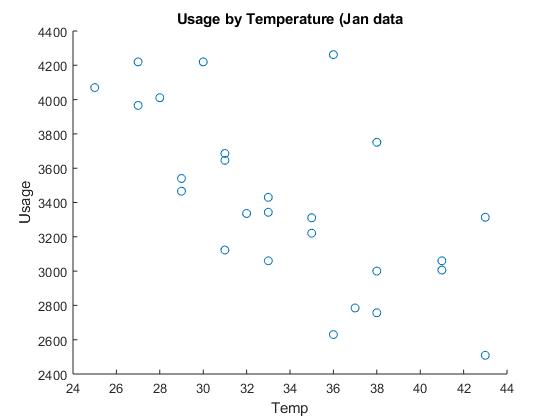
The MATLAB scatterplot clearly shows at low temperatures (towards the left), the most electricity is consumed (data points higher). The various near pairs (at 29, 31, 33, 35, and 42 degrees) are interesting. They indicate that our power consumption is a nearly repeatable amount. Other values at those temperatures indicate Januaries when we had guests or work done in the house or left the Christmas lights up until well after the Epiphany.
Future MATLAB Investigations
I may investigate our baseline electricity consumption upon which heating and A/C contribute to the bill in winter and summer.
Probably the number one remaining task is to see how good a mathematical relationship I can fit to the data.
The upshot is that MATLAB has made analyzing the data easier. Voila!

1 thought on “Home Electric Use and MATLAB”